

推荐系统面试经验
参考
面试经验
一、机器学习相关
机器学习
介绍一个最熟悉的机器学习算法
决策树怎么建树,基尼系数公式
Adaboost拟合目标是什么
Adaboost介绍一下,每个基学习器的权重怎么得到的
介绍下GBDT
介绍XGBoost
介绍下LightGBM
LightGBM相对于XGBoost的改进
GBDT中的梯度是什么,怎么用
GBDT如何计算特征重要性
GBDT讲一下,GBDT拟合残差,是真实的误差嘛,在什么情况下看做是真实的误差
介绍XGBoost中的并行
介绍XGBoost中精确算法与近似算法
XGBoost如何处理空缺值,为何要进行行采样、列采样
讲一下xgboost算法,xgboost是如何处理离散特征的,xgb怎么训练,xgb算法优点,怎么选特征,主要参数有哪些,xgb的特征重要性怎么看
xgboost介绍一下,xgb对目标函数二阶泰勒展开,哪个是x,哪个是delta x, 一阶导和二阶导是对谁求得
为什么高维稀疏数据,LR比GBDT要好
随机森林与GBDT采样的区别
随机森林中列采样的作用
bagging与boosting对比, boosting和bagging的区别 ...
赛题项目:阿里天池新闻推荐
参考
赛题项目:阿里天池新闻推荐
在掌握推荐系统的核心方法后,本章将通过一个完整的项目实践,展示如何将理论知识应用于实践。我们将从需求理解与数据分析入手,建立评测指标与基线;然后逐步构建多路召回与冷启动策略,开展特征工程,并训练排序模型;最后对结果进行验证与融合。本章旨在将前述章节的算法与技术串联起来,覆盖从数据处理、模型构建到离线评测的完整流程,帮助读者建立系统化的实战能力。
一、赛题理解
赛题理解是切入一道赛题的基础,会影响后续特征工程和模型构建等各种工作,也影响着后续发展工作的方向,正确了解赛题背后的思想以及赛题业务逻辑的清晰,有利于花费更少时间构建更为有效的特征模型, 在各种比赛中, 赛题理解都是极其重要且必须走好的第一步, 今天我们就从赛题的理解出发, 首先了解一下这次赛题的概况和数据,从中分析赛题以及大致的处理方式, 其次我们了解模型评测的指标,最后对赛题的理解整理一些经验。
此次比赛是新闻推荐场景下的用户行为预测挑战赛, 该赛题是以新闻APP中的新闻推荐为背景, 目的是要求我们根据用户历史浏览点击新闻文章的数据信息预测用户未来的点击行为, 即用户的最后一次点击的新 ...
热点(三)生成式推荐
参考
热点(三)生成式推荐
在前面的召回章节中,我们探讨了以SASRec为代表的生成式召回方法,它们将推荐问题重新定义为序列预测任务,通过自回归的方式预测用户下一个可能交互的物品。这种范式的成功验证了一个重要观点:推荐系统可以从传统的"判别式打分"转向"自回归生成",借鉴自然语言处理领域的成功经验,将用户行为序列视为一种特殊的"语言"来理解和生成。
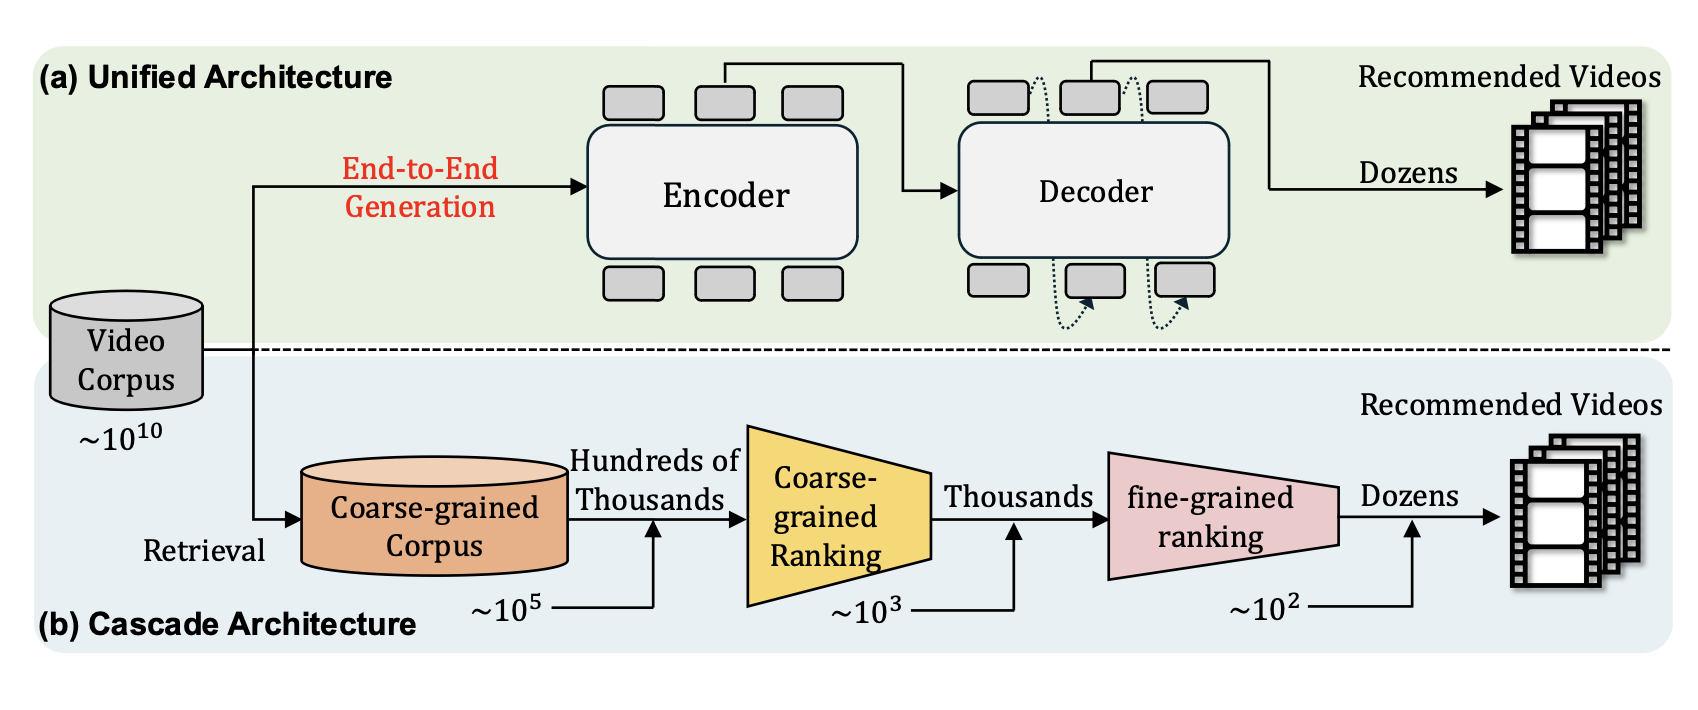
生成式推荐的核心在于三个关键要素的重新设计:输入如何组织(从简单的物品ID序列到复杂的事件流)、输出生成什么(从原子ID到语义化表示)、以及目标与架构如何取舍(在表达能力与计算效率间寻求平衡)。围绕这三个维度,生成式推荐沿着三条清晰的演进路径不断发展:一是生成式召回,延续SASRec的思路但在输入和输出上进行深度创新;二是生成式排序,将生成范式引入传统的排序阶段;三是端到端统一生成,试图用单一模型完成从召回到排序的全流程。
1、生成式召回的深化演进
生成式召回在SASRec奠定的基础上,主要沿着两个方向进行深化探索。HSTU模型 代表了对"输入"理解的深化, ...
热点(二)冷启动问题
参考
热点(二)冷启动问题
1、内容冷启动
在推荐系统的发展历程中,内容冷启动一直是一个核心挑战。新上线的物品由于缺乏用户交互历史,传统的协同过滤方法难以为其提供有效推荐。而基于内容的方法虽然能够处理新物品,但推荐质量往往不如协同过滤。
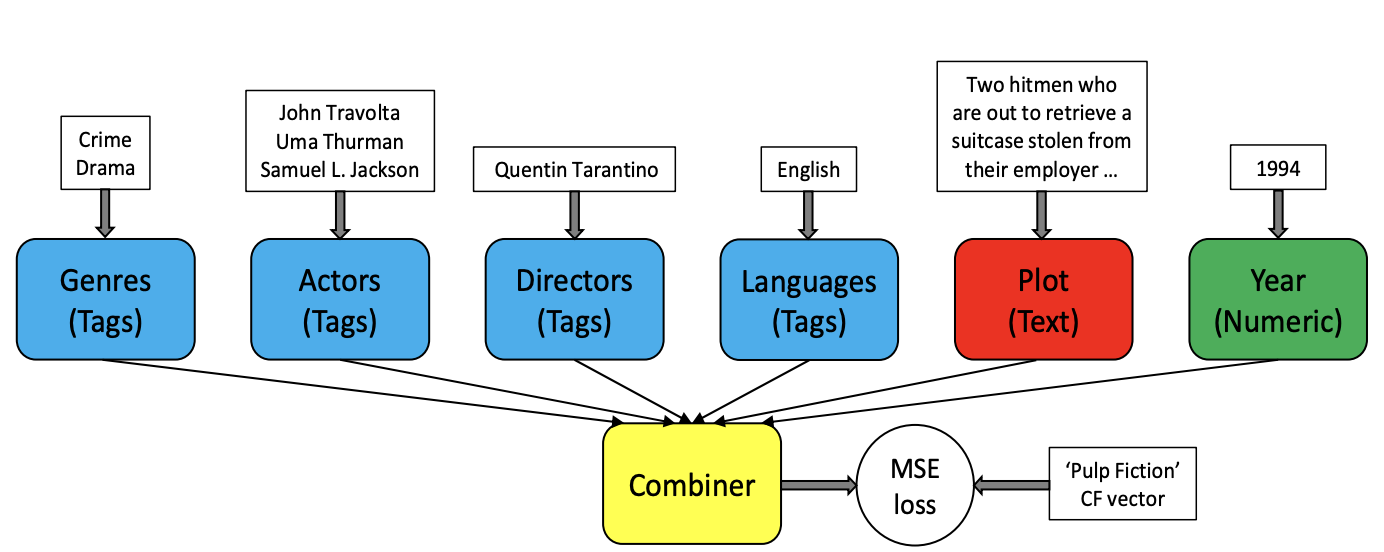
针对这一挑战,研究者们提出了多种创新解决方案。本节将重点介绍两种具有代表性的方法:CB2CF(Content-Based to Collaborative Filtering)和MetaEmbedding。CB2CF通过学习内容特征到协同过滤表示的映射关系,让新物品能够直接获得协同过滤质量的推荐效果;MetaEmbedding则通过元学习的思想,利用物品的辅助属性信息为新物品生成更好的初始embedding表示。这两种方法从不同角度解决了内容冷启动问题,为推荐系统的实际应用提供了有效的技术支撑。
1.1 CB2CF
协同过滤依赖用户-物品交互数据学习用户偏好和物品特征,能够发现复杂的隐式关联模式,但面对新物品时束手无策。基于内容的方法利用物品的属性信息进行推荐,可以处理新物品,但往往只能捕捉到表面的相似性。
这种分离带来了一个根本性问题:如何让新物 ...

热点(一)模型去偏
参考
热点(一)模型去偏
推荐系统在为用户提供个性化服务的过程中,面临着一个容易被忽视但极其重要的问题:我们用来训练模型的数据本身可靠吗?与严格控制的实验室环境不同,推荐系统的数据来源于用户在真实场景中的交互行为。这些观测数据不可避免地受到系统策略、用户习惯、物品流行度等多种因素的影响,导致数据中存在各种偏差。
更值得关注的是,推荐系统存在一个天然的反馈闭环:模型的推荐结果会影响用户的未来行为,而这些行为又会成为新的训练数据来更新模型。这种闭环机制会像滚雪球一样不断放大初始数据中的偏差,最终可能导致推荐结果的单一化和不公平性。
偏差的类型与影响
推荐系统中的偏差可以按照产生阶段分为两大类 :数据偏差和结果偏差。数据偏差发生在数据收集阶段,是后续问题的根源;结果偏差则体现在推荐结果中,是数据偏差经过模型处理后的表现。
数据偏差的核心问题在于训练数据的分布与理想测试数据的分布存在差异。在推荐系统中,这种差异主要体现在以下几个方面:
选择偏差是显式反馈场景中的典型问题。用户倾向于只对自己感兴趣的内容进行评分,这导致我们观测到的评分数据并非所有可能评分的随机样本。研究表明,用户主动评 ...
重排(二)个性化重排
参考
重排(二)个性化重排
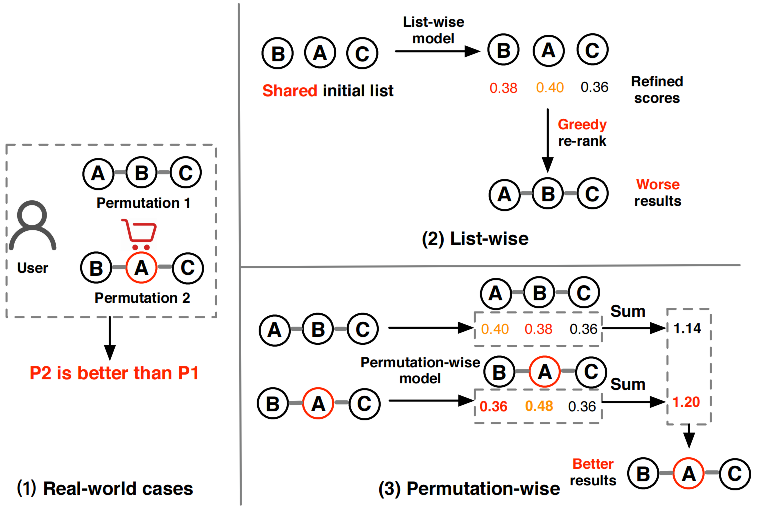
上一节我们探讨了基于贪心策略的重排序方法,如MMR (Maximal Marginal Relevance) 和 DPP (Determinantal Point Processes)。这些方法通过显式定义多样性、相关性或覆盖度的优化目标,在初始排序列表上进行局部调整。它们计算高效且可解释性强,但在处理复杂的物品间相互影响和深度个性化方面存在局限:目标函数往往需要手工设计,难以捕捉高阶、非线性的交互模式;同时,将用户个性化信息深度融入列表级优化也颇具挑战。
接下来会介绍两个经典的个性化重排模型:PRM和PRS。
1、PRM:基于Transformer的个性化重排
原理
PRM (Personalized Re-Ranking Model) 的提出,标志着重排序技术从基于规则/启发式向数据驱动、端到端学习的重要转变。其核心思想是:利用强大的序列建模能力(Transformer)自动学习列表中物品间复杂的相互影响,并将细粒度的用户个性化信息深度融入整个重排序过程,通过最大化列表级效用目标(如点击率)进行全局优化。 PRM不再依赖预设的多样性公式,而是让模型直 ...

重排(一)贪心重排
参考
重排(一)贪心重排
贪心算法以其思路直观、计算高效、易于实现的特点,成为重排阶段解决多样性、新颖性等问题的首选策略之一。它们通常不依赖复杂的模型训练,而是基于预先定义的规则或目标函数,通过逐步选择当前最优解(贪心选择)的方式来构建或调整最终推荐列表。本节将深入剖析两种经典的、基于贪心的重排算法:最大边际相关(Maximal Marginal Relevance, MMR) 和 行列式点过程(Determinantal Point Process, DPP)。
1、MMR:最大边际相关
原理
在精排输出的按CTR降序排列的列表中,头部物品往往具有高度相似性(如连续推荐同品类商品或同风格视频)。这种同质化现象直接导致两大问题:
用户体验恶化:用户浏览时产生审美疲劳,兴趣衰减速度加快;
系统效率损失:长尾优质内容曝光不足,平台生态多样性下降。
MMR算法 的核心目标是在保留高相关性物品的前提下,通过主动引入多样性打破同质化,实现“相关性与多样性的帕累托最优”。
MMR通过定义边际收益函数量化物品对列表的增量价值:
MR(i)=λ⋅Rel(i)⏟相关性−(1−λ)⋅maxj∈S ...
精排(五)多场景建模
参考
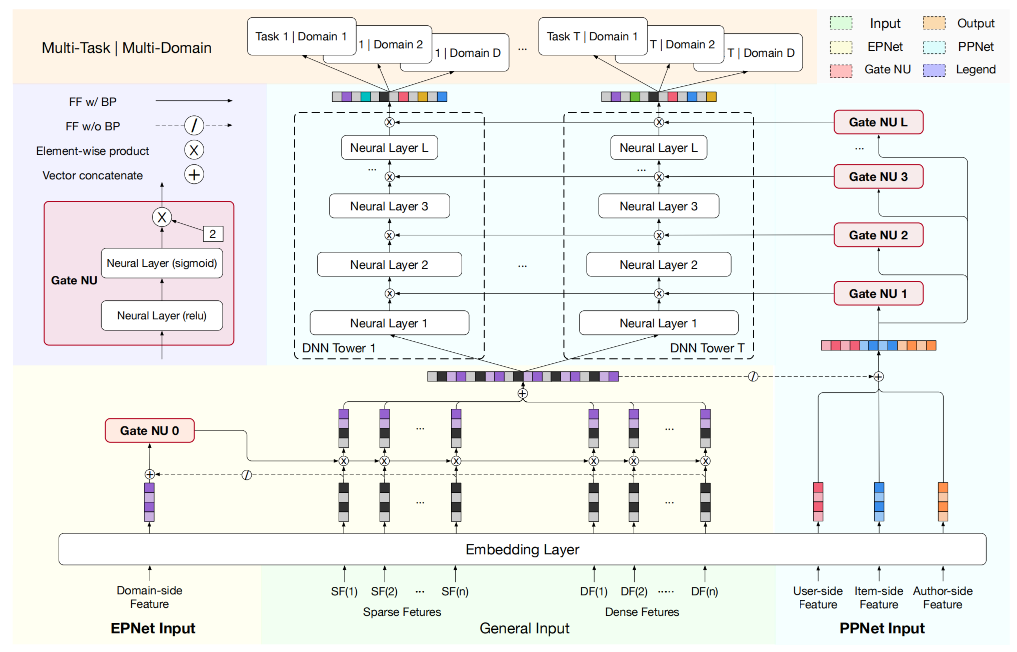
精排(五)多场景建模
在现代大规模推荐系统中,用户的行为和兴趣往往呈现出高度的场景依赖性。这里的“场景”可以指不同的业务形态(如电商APP的首页推荐、商品详情页的“猜你喜欢”、购物车页的“你可能还想要”)、不同的流量入口(如主站、独立子频道)、不同的用户状态(如新用户、老用户、活跃用户、沉默用户)、甚至不同的设备或时间上下文。传统的单一全局模型,试图用一个“万能”的模型覆盖所有场景,常常面临场景特性淹没与数据稀疏性的双重困境:
共性淹没特性: 强行融合所有场景数据训练,模型容易被数据量大的主导场景所主导,难以捕捉和适应小场景或特性鲜明场景的独特模式。
数据稀疏性: 对于新场景、小流量场景或长尾用户群体,独立建模所需的高质量训练数据往往不足,导致模型效果不佳。
参数效率低下: 为每个场景独立训练和维护一个完整模型,成本高昂且难以实现场景间的知识迁移。
多场景建模(Multi-scenario Modeling / Multi-domain Modeling) 正是为了解决这些核心挑战而提出的关键技术范式。其核心思想在于:充分利用多个场景数据之间的潜在“共性”来提升模型的泛化 ...

精排(四)多目标建模
参考
精排(四)多目标建模
多目标建模(Multi-Task Learning, MTL)通过联合优化多个相关任务,在推荐系统中实现用户体验与商业目标的协同提升。相比独立建模,多目标方法能够降低参数量、提升系统效率,并通过知识迁移缓解数据稀疏问题。
在实际应用中,电商场景联合优化CTR、CVR、GMV避免单一指标导致的低质商品推荐;视频平台同时优化播放完成率、评分预测、用户留存率提升长期用户价值。然而,多目标建模面临任务冲突、跷跷板效应和负迁移等核心挑战。
针对这些挑战,业界发展出三大解决方向:模型架构从Shared-Bottom到MMoE再到PLE的演进,解决任务冲突与负迁移;ESMM和ESM2等依赖关系建模方法,处理用户行为链路的样本偏差;以及从手工加权到自适应优化的多损失融合策略,解决量级失衡与收敛异步问题。
本章将详细介绍这些核心技术的原理与实践。
1、基础结构演进
1.1 Shared-Bottom
原理
Shared-Bottom 模型作为多目标建模的奠基性架构,采用"共享地基+独立塔楼"的设计范式。其核心结构包含两个关键组件:
共享底层(Sha ...

精排(三)序列建模
参考
精排(三)序列建模
在上一节中,我们探讨了如何通过各类特征交叉模型,让机器自动学习特征之间复杂的组合关系。无论是二阶交叉的FM、AFM,还是高阶交叉的DCN、xDeepFM,它们的核心目标都是从一个静态的特征集合中挖掘出有价值的信息。然而,这些模型普遍存在一个共同的局限:它们大多将用户的历史行为看作一个无序的"物品袋"(a bag of items),如同用户的兴趣是一个静态的表示。
但用户的兴趣不是静止的,而是具有明显的时序性和动态演化特点。一个用户先浏览"鼠标"再浏览"显示器",与先浏览"小说"再浏览"显示器",这两个行为序列背后指向的购买意图截然不同。前者可能是一位正在组装电脑的数码爱好者,而后者可能只是在工作之余的随性浏览。传统的特征交叉模型难以捕捉这种蕴含在行为顺序中的、随时间变化的意图。
因此,本节我们将转换视角,不再将用户历史看作一堆静态特征的集合,而是将其视为一个动态的序列。我们将聚焦于如何对用户的行为序列进行建模,从这个序列中挖掘出用户动态、演化的兴趣。接下来 ...